
|
| USYRU MHS Data |
|
Polar Diagrams Polar diagrams are a graphic way of presenting velocity prediction data. They are used by racers do determine weather a boat is sailing to it's full potential on a particular point of sail, in particular wind speed. These polars for the 10M are for a max 160% genoa. Each line on the plot represents a different wind speed. The boat speed is shown on the radial lines with tick marks (the distance from the center of the plot). There is a different plot for true and apparant wind. The plots also show the optimim downwind angle relative to the wind. That's the sailing angle that will result in the fastest progress directly down wind and is a combination of boat speed and angle. USYRA VPP Data for 10M
Check out these books for more details: |
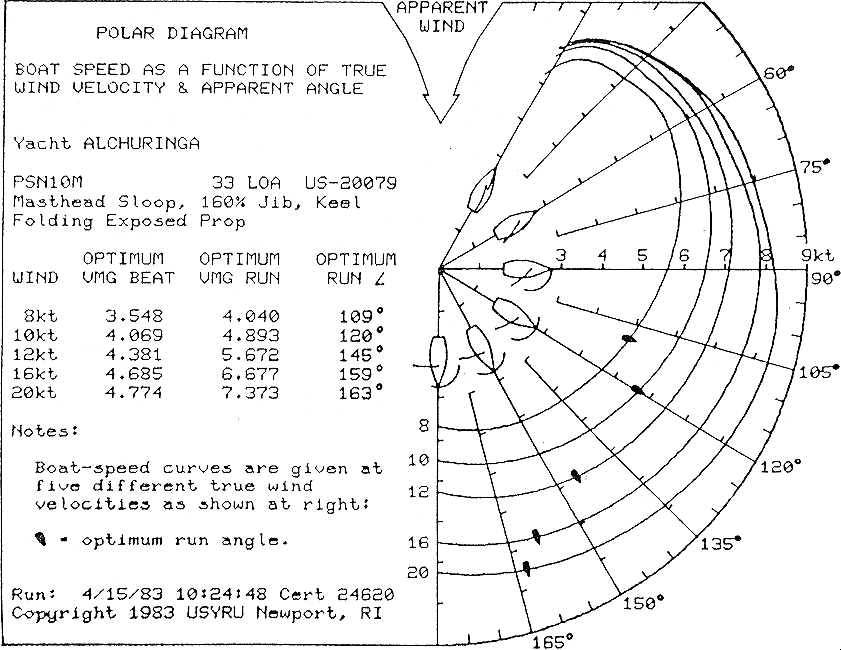 Apparant Wind 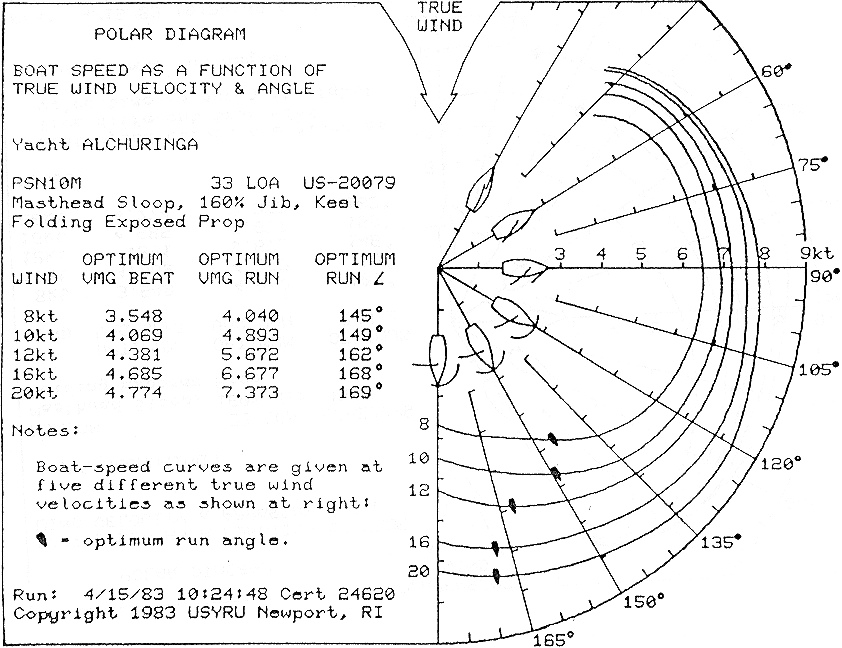 True Wind |
|
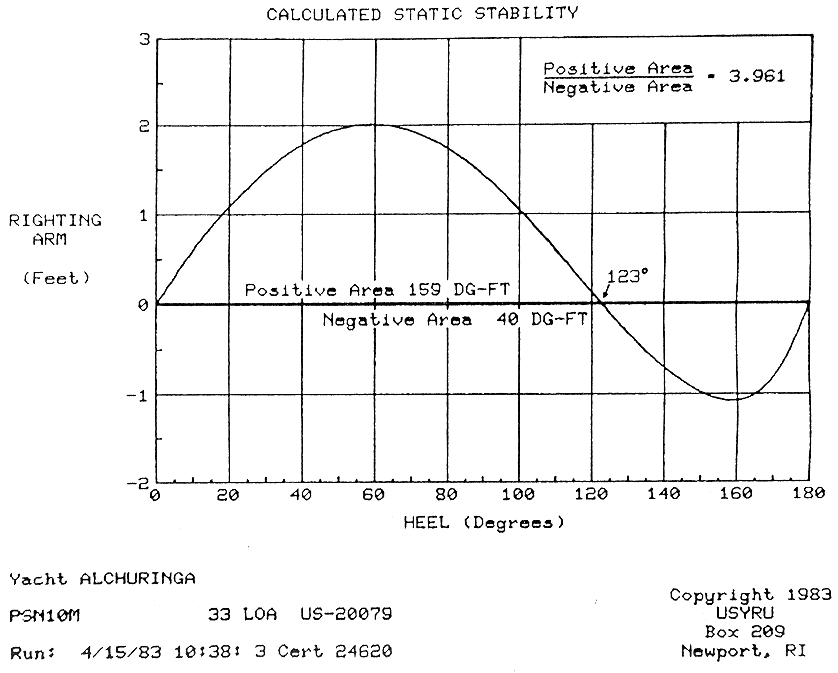
Stability Curve The stability curve is a graphic presentation of a boats static stability. As the boat heels it develops righting moment which is the force created by the ballast and hull buoyancy that works to resist the heeling. The stability curve shows this righting arm (righting moment divided by displacement) as a function of heel angle. When the righting arm turns negative (at 123 degree for this diagram) the boat will no longer resist the heeling force and will capsize. An important measurement on the righting curve is the relative areas under the positive and negative parts of the curve. In this curve the positive is 3.96 timers greater then the negative. That means it takes 3.96 times as much energy to turn the boat from upright to capsize as from capsize to upright.
The point where the curve goes from positive to negative is called the Limit of Positive Stability (LPS) or the angle of vanishing stability (AVS). For the 10M that was measured for this curve it was 123 degrees. That's pretty good for a mid 70's production cruiser racer. A lot of it is probably from the deep keel and high ballast ratio of the 10M (six feet and 44%). But the boat that was measured may not have been representative. It may have been a boat set up in stripped racing trim. The addition of any gear above the center of gravity will degrade the LPS. The measured 10M probably had a hank on jib. A roller furling can make a much bigger difference to the LPS then might be expected. In the 30th anniversary edition of Adlard Coles' "Heavy Weather Sailing" (Peter Bruce Ed.) they compared two 28.5 foot boats of the same class, one with a conventional rig, the other with roller furling jib and in-mast roller furling main. The LPS was 127 deg for the conventional and 96 deg for the roller equipped. The in mast roller main was likely the major component of the reduction but I would not under-estimate the effects of some of the older heavy rollers like the Hood Seafurl that came on my 10M.
Stability is a very complicated subject and this static stability curve is not the complete story. Check out these books for more details: |
 Stability Curve |
Boats with certificates

11203
USA-13506 LOA: 33.05
GPH: 687.1 LEPRECHAUN
1/22/02 11:15:50 AM Pearson 10M
SHAW, WM  I: 44.10 J: 14.11
P: 38.44 E: 11.03 DSPL: 12048 Draft: 5.71

15188
USA-22215 LOA: 33.05
GPH: 688.2 RAMBUNCTIOUS
Former: SAU-LYNNE
1/21/02 2:09:10 PM Pearson 10M
SHAW, WM  I: 43.53 J: 14.13
P: 38.10 E: 11.01 DSPL: 12261 Draft: 5.73

18731
USA-32463 LOA: 33.05
GPH: 688.2 SCHURR THING
Former: HELEN J.
1/18/02 9:53:57 AM Pearson 10M
SHAW, WM  I: 43.82 J: 14.09
P: 38.00 E: 11.00 DSPL: 12268 Draft: 5.72

11073
USA-8642 LOA: 33.05
GPH: 695.2 BLUE LOU
1/22/02 11:15:10 AM Pearson 10M
SHAW, WM  I: 43.75 J: 14.10
P: 38.57 E: 11.23 DSPL: 12850 Draft: 5.78

15542
USA-14335 LOA: 33.05
GPH: 694.2 RED DUSTER
1/21/02 2:15:27 PM Pearson 10M
SHAW, WM  I: 44.00 J: 14.19
P: 38.45 E: 11.10 DSPL: 12857 Draft: 5.78

19911
USA-8231 LOA: 33.05
GPH: 689.0 DESPERADO
1/17/02 10:42:04 AM Pearson 10M
 I: 43.87 J: 14.10
P: 38.50 E: 13.20 DSPL: 12922 Draft: 5.80

18238
USA-23877 LOA: 33.05
GPH: 706.5 MIEN DIRN
1/18/02 3:03:24 PM Pearson 10M
SHAW, WM  I: 43.86 J: 14.12
P: 38.43 E: 11.00 DSPL: 13143 Draft: 5.81